
該數據集提供了截至 2024 年德克薩斯州房地產市場的全面快照,精選了 500 個房產清單。它涵蓋了各種各樣的房產,反映了德克薩斯州多樣化的房地產格局。該數據集是瞭解該州市場動態、房地產估值和區域住房趨勢的基礎工具。[1]
數據包含15種資訊:
1. url(Realtor.com 上房產清單的網址)
2. status: 可用性
3. id: 唯一標示符
4. listPrice: 價錢
5. baths: 浴室總數
6. baths_full: 完整浴室總數
7. baths_full_calc: 計算出的完整浴室數量,以確保一致性
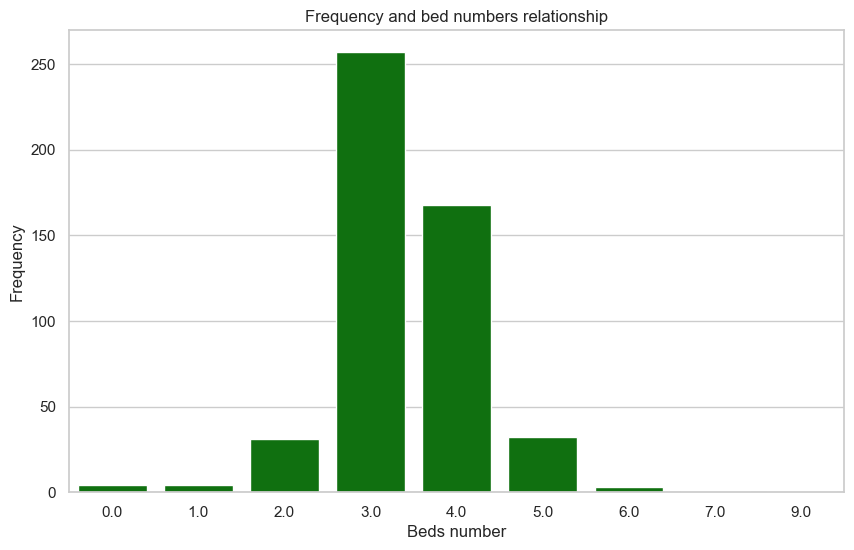
8. beds: 臥室數量
9. sqft: 建物的總平方英尺
10. sqft: 建物的總平方英尺
11. stories: 建物的層數或樓層數
12. sub_type: 特定子類別
13. text: 建物敘述
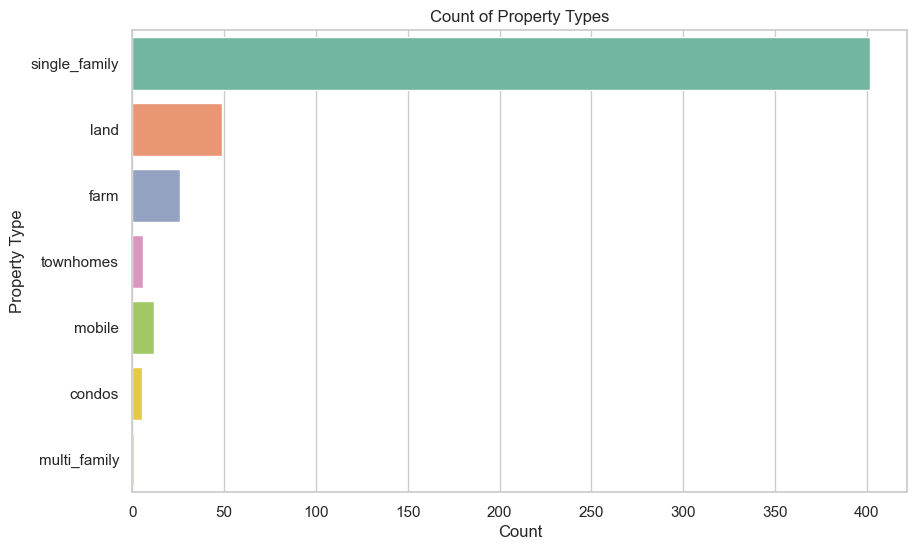
14. type: 類別(e.g. 單戶住宅、公寓)
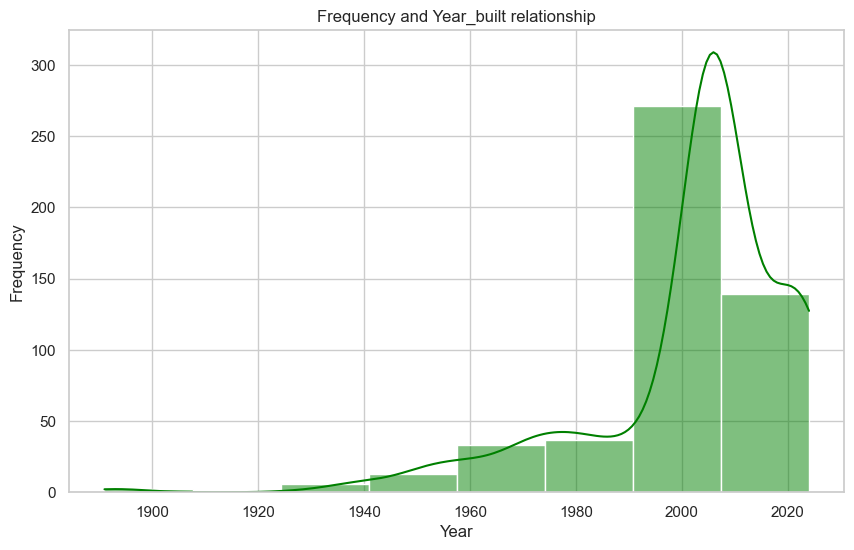
15. year_built: 建物建成年分
data在kaggle上Texas Real Estate Trends 2024 page上取得。
| listprice | baths | baths_full | beds | sqft | stories | type | year_built | |
|---|---|---|---|---|---|---|---|---|
| 0 | 240000.0 | 2 | 2.0 | 3.0 | 1190.0 | 1.0 | single_family | 2018.0 |
| 1 | 378800.0 | 4 | 3.0 | 4.0 | 2033.0 | 1.0 | single_family | 2002.0 |
| 2 | 370000.0 | 2 | 2.0 | 4.0 | 2062.0 | 1.0 | single_family | 2012.0 |
| 3 | 444000.0 | 4 | 3.0 | 5.0 | 3705.0 | 2.0 | single_family | 1985.0 |
| 4 | 569000.0 | 2 | 2.0 | 3.0 | 3282.0 | 2.0 | single_family | 1981.0 |
                    RangeIndex: 501 entries, 0 to 500
                    Data columns (total 8 columns):
                        #   Column      Non-Null Count  Dtype
                    ---  ------      --------------  -----
                        0   listprice   501 non-null    float64
                        1   baths       501 non-null    int64
                        2   baths_full  501 non-null    float64
                        3   beds        501 non-null    float64
                        4   sqft        501 non-null    float64
                        5   stories     501 non-null    float64
                        6   type        501 non-null    object
                        7   year_built  501 non-null    float64
                    dtypes: float64(6), int64(1), object(1)
                    memory usage: 31.4+ KB
| listpriceyear_built | average_listing_price | average_square_footage | |
|---|---|---|---|
| 0 | 1891.0 | 800000.00 | 1634.0 |
| 1 | 1895.0 | 499800.0 | 1752.0 |
| 2 | 1930.0 | 280000.0 | 2448.0 |
| 3 | 1938.0 | 1349000.0 | 2590.0 |
| 4 | 1939.0 | 519900.0 | 3493.0 |
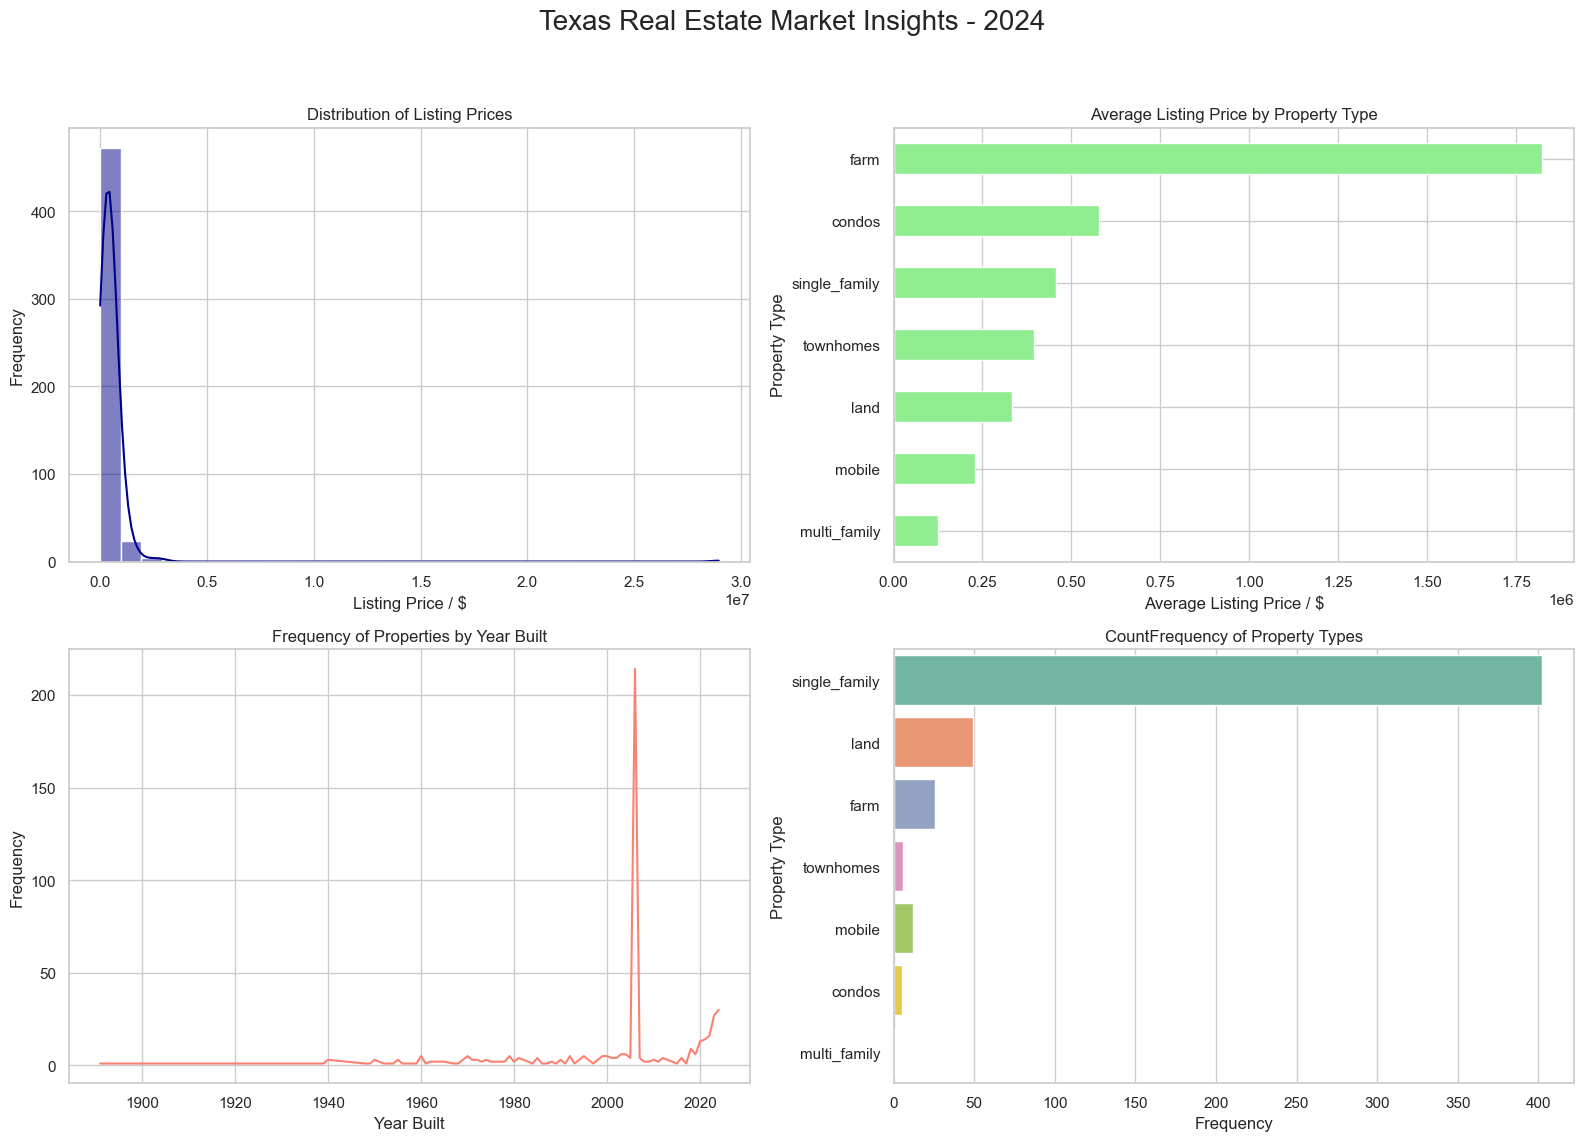
透過簡單的資料分析與處理能得到2024年Texas房產的整理資訊,房產的中位數價格、房產類型、建物建成年分與價格對建物的相關性圖對後續分析皆有一定用處。