
該數據集包含 6574 個每日平均的氣象監測數值,數據來自氣象站中的 5 個天氣變數感測器。提供了地面每日的平均風速、降水量、最高和最低溫度以及草地最低溫度。而該設備位於離地面21公尺處的空曠區域。最後,數據記錄從1961年1月至1978年12月(17年)。[1]
數據包含9種:
1. DATE (YYYY-MM-DD)
2. WIND: Average wind speed / knots
3. IND: First indicator value
4. RAIN: Precipitation Amount / mm
5. IND.1: Second indicator value
6. T.MAX: Maximum Temperature / °C
7. IND.2: Third indicator value
8. T.MIN: Minimum Temperature / °C
9. T.MIN.G: 09utc Grass Minimum Temperature / °C

data在kaggle上Wind Speed Prediction Dataset page上取得。
                        Index: 6574 entries, 1961-01-01 to 1978-12-31
                        Data columns (total 8 columns):
                         #   Column   Non-Null Count  Dtype
                        ---  ------   --------------  -----
                         0   wind     6574 non-null   float64
                         1   ind      6574 non-null   int64
                         2   rain     6574 non-null   float64
                         3   ind.1    6574 non-null   float64
                         4   t.max    6574 non-null   float64
                         5   ind.2    6574 non-null   float64
                         6   t.min    6574 non-null   float64
                         7   t.min.g  6574 non-null   float64
                        dtypes: float64(7), int64(1)
                        memory usage: 462.2+ KB
| wind | ind | rain | ind.1 | t.max | ind.2 | t.min | t.min.g | |
|---|---|---|---|---|---|---|---|---|
| date | ||||||||
| 1961-01-01 | 13.67 | 0 | 0.2 | 0.0 | 9.5 | 0.0 | 3.7 | -1.0 |
| 1961-01-02 | 11.50 | 0 | 5.1 | 0.0 | 7.2 | 0.0 | 4.2 | 1.1 |
| 1961-01-03 | 11.25 | 0 | 0.4 | 0.0 | 5.5 | 0.0 | 0.5 | -0.5 |
| 1961-01-04 | 8.63 | 0 | 0.2 | 0.0 | 5.6 | 0.0 | 0.4 | -3.2 |
| 1961-01-05 | 11.92 | 0 | 10.4 | 0.0 | 7.2 | 1.0 | -1.5 | -7.5 |
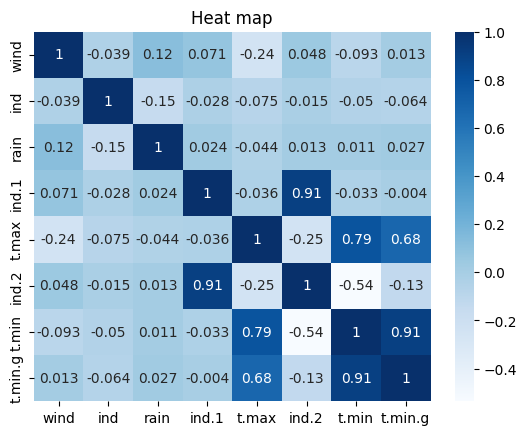
summary: positive relation between wind and rain; negative relation between wind and Tmax.
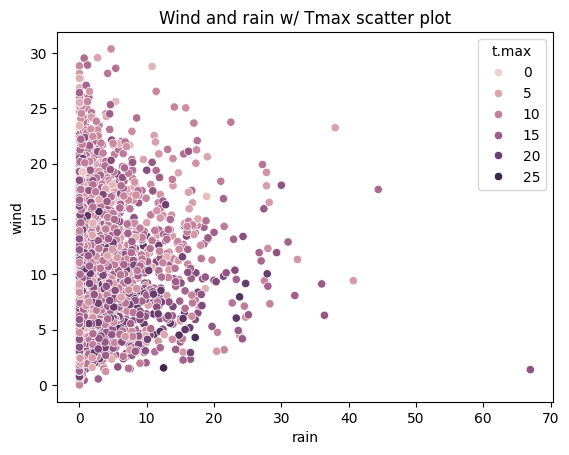
vrey small positive correlation between wind speed and rain
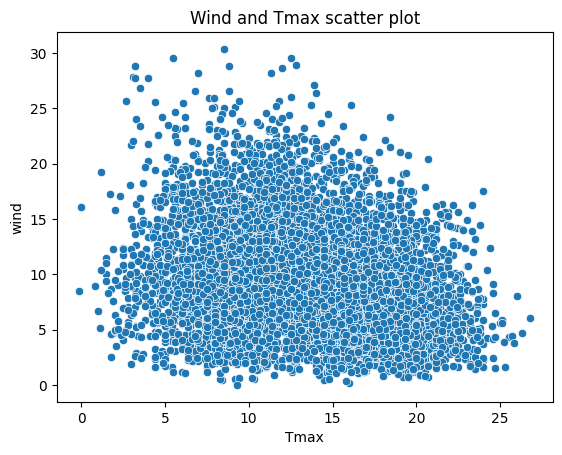
negative correlation between wind speed and Tmax, and we'll try to get the linear function.
summary: trying to get linear function between wind speed and t.max.
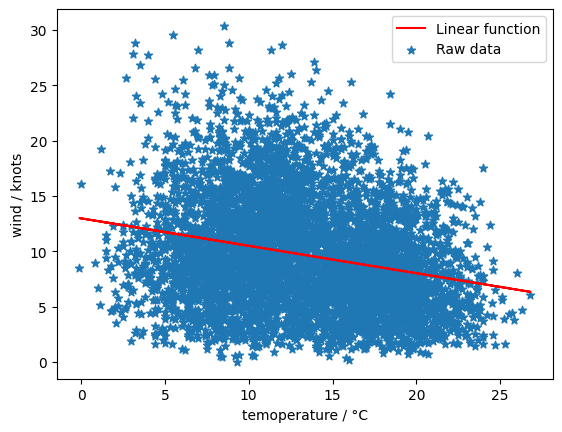
Learned function: wind-speed = Tmax * -0.25 + 12.97.
R^2 score: 0.06024145161228922.
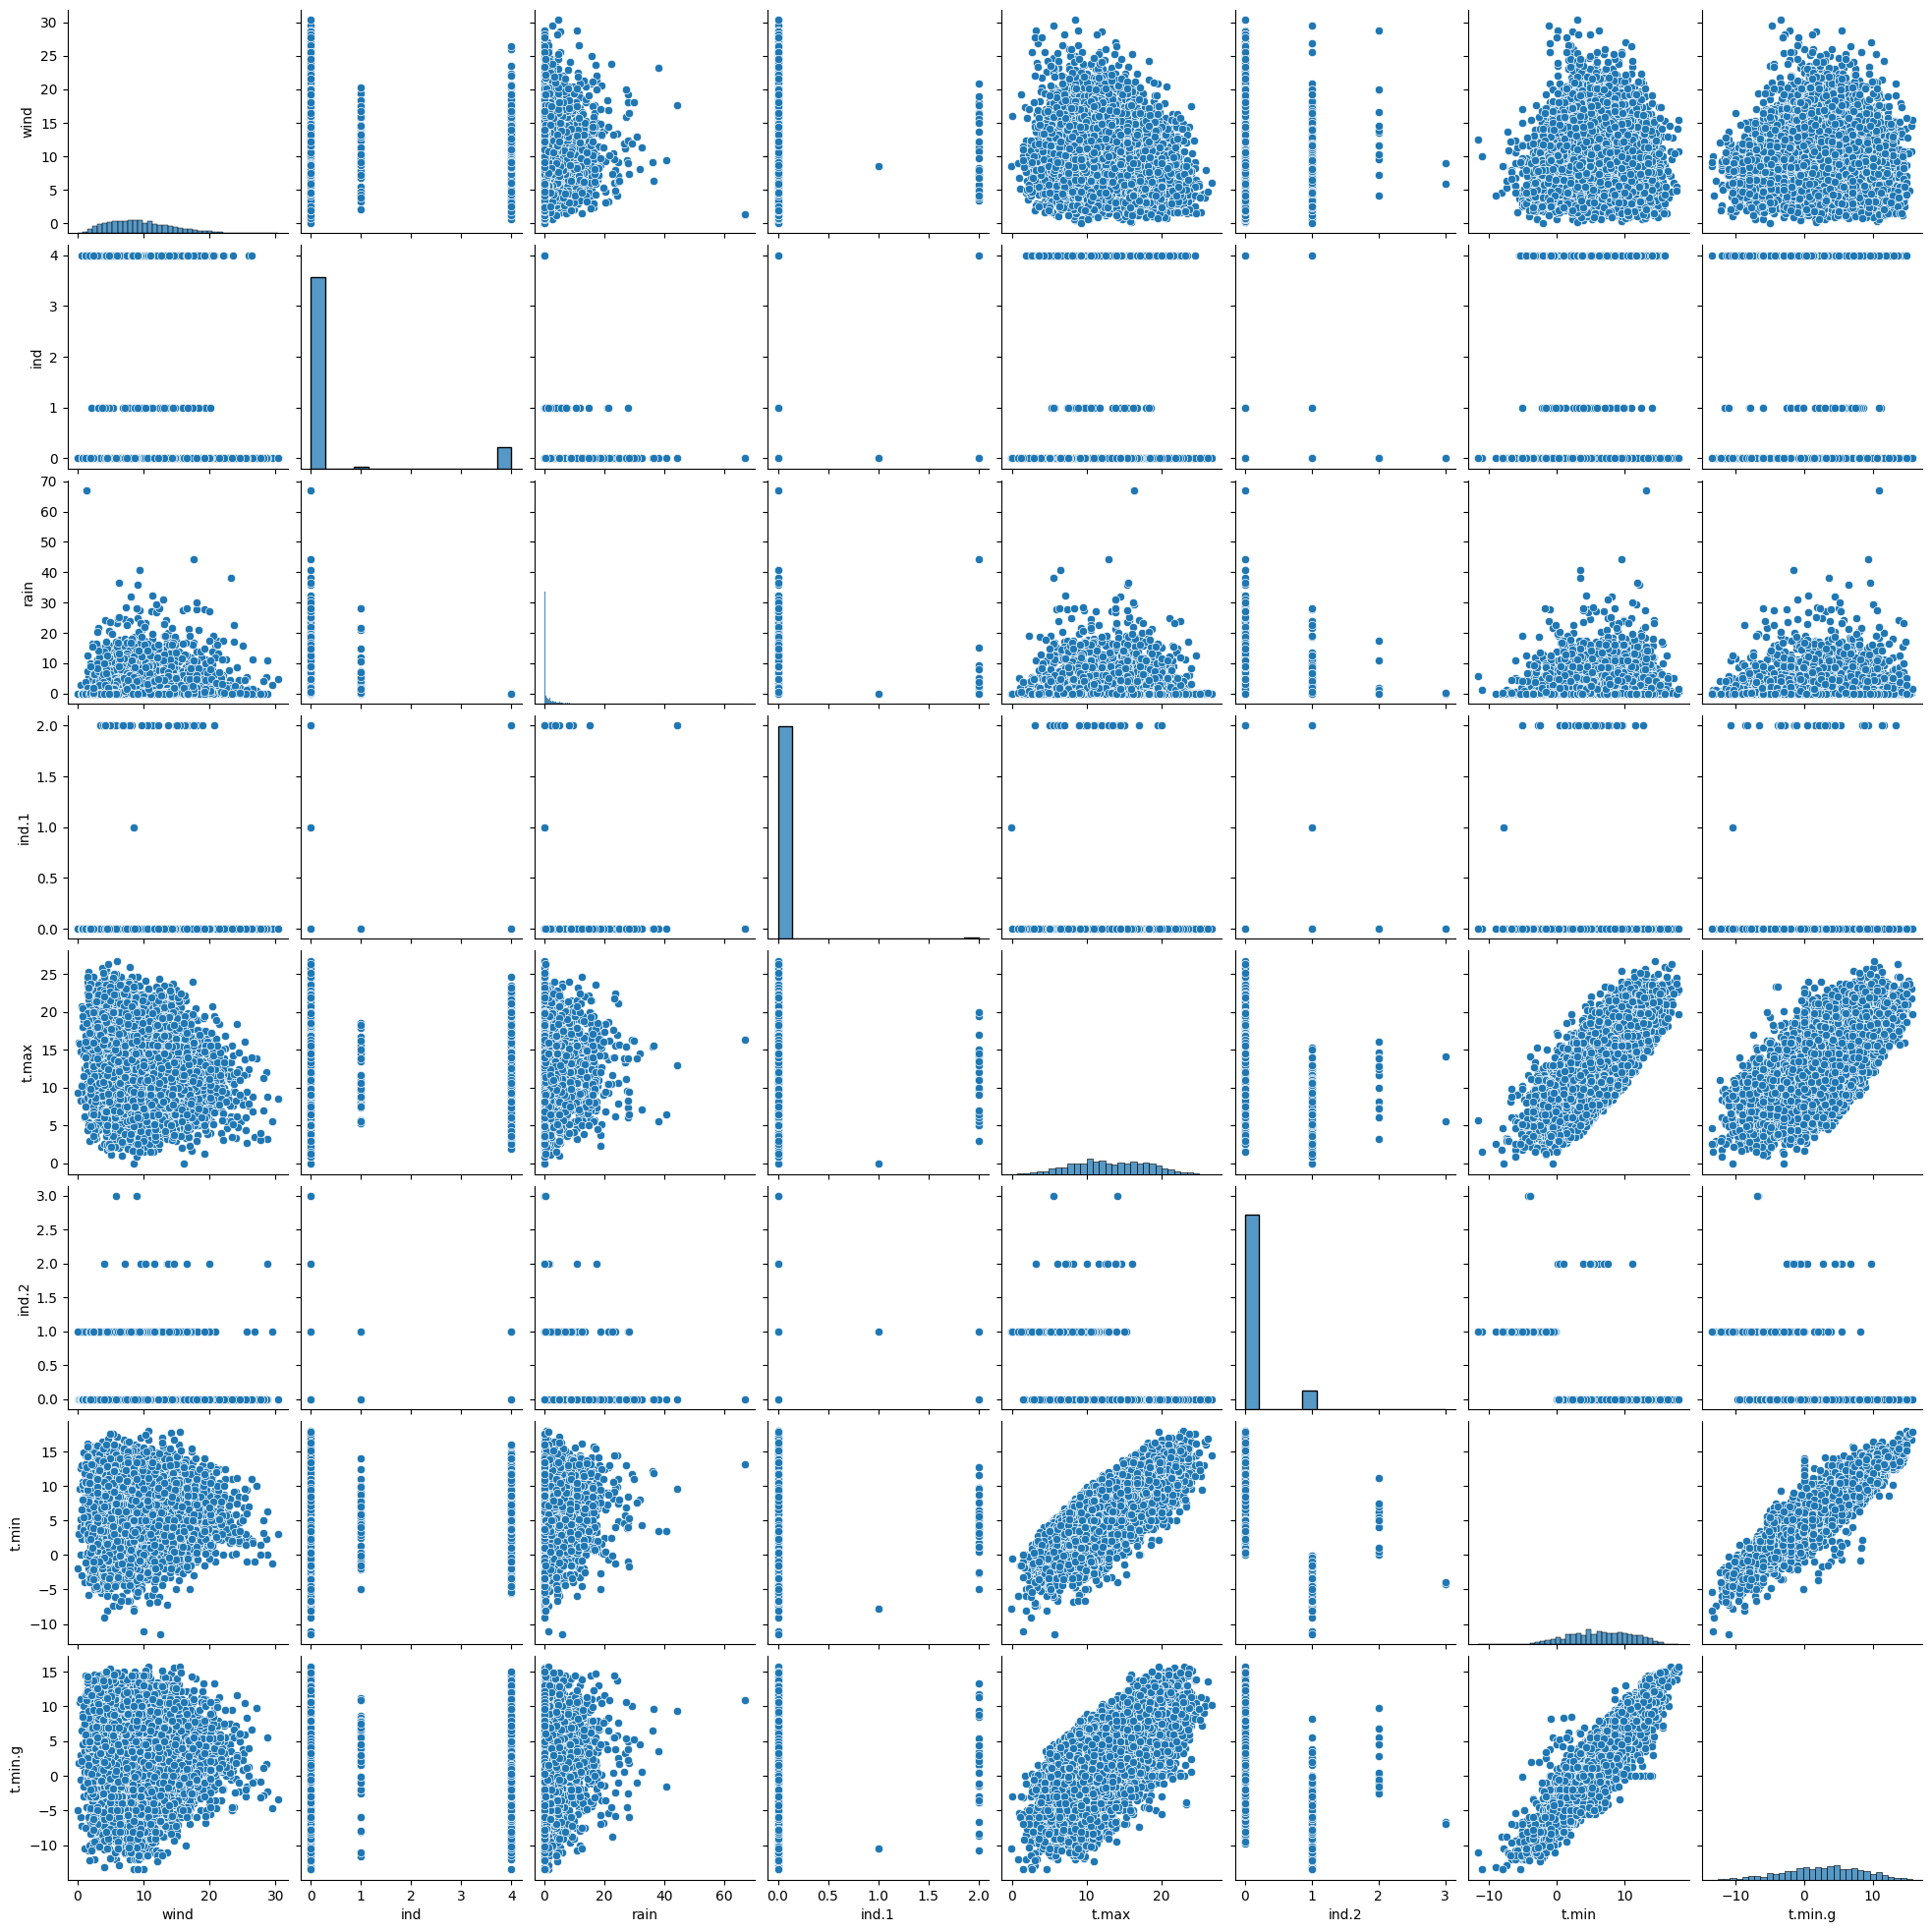
summary: most parameters don't have correlation (especially at the wind speed row), so it's hard to find model to predict wind speed.
                    LinearRegression

                    mean squared error: 22.05396295252656

                    mean absolute error: 3.748737638719434


                    Lasso

                    mean squared error: 25.020399659795157

                    mean absolute error: 4.021720674389802


                    Ridge

                    mean squared error: 22.05417347787967

                    mean absolute error: 3.7487905093006786


                    BayesianRidge

                    mean squared error: 22.05976546092399

                    mean absolute error: 3.750122429103166


                    DecisionTreeRegressor

                    mean squared error: 41.40043724949303

                    mean absolute error: 5.037650063371356


                    LinearSVR

                    mean squared error: 22.223617774558146

                    mean absolute error: 3.708201011556171


                    KNeighborsRegressor

                    mean squared error: 24.108564474524712

                    mean absolute error: 3.865565019011407


                    RandomForestRegressor

                    mean squared error: 22.468313202761145

                    mean absolute error: 3.679676887431959
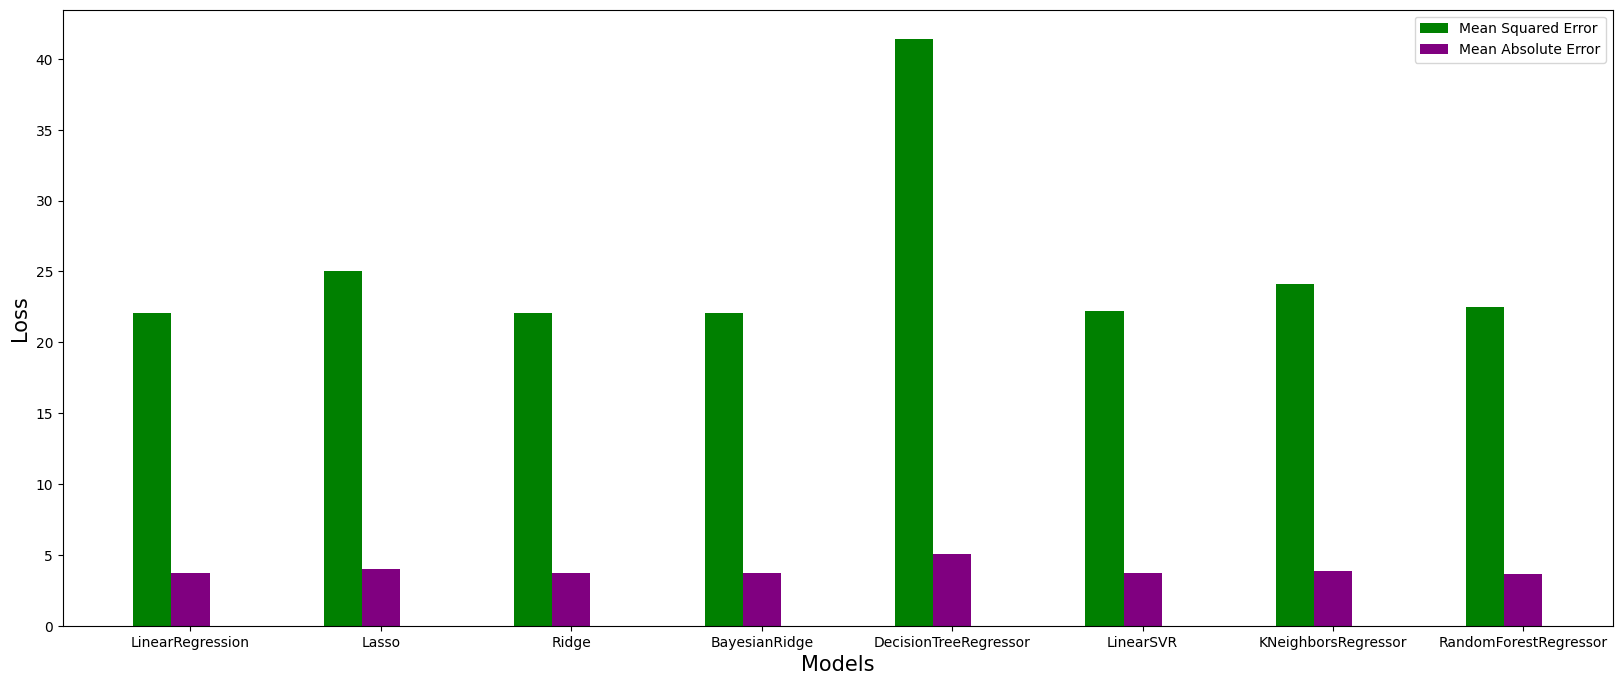
RandomForestRegressor和LinearSVR兩模型有較小的mean squared error loss和mean absolute error loss,說明使用兩模型來預測wind speed較為準確。